In July 2023, we started receiving occasional timeout alerts from our uptime monitoring service. The alerts would quickly resolve, but they kept happening.
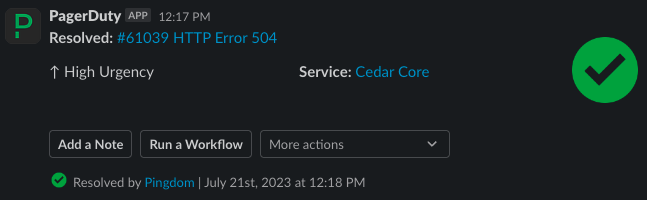
We were concerned because we knew our users were likely experiencing slow page loads and occasional timeouts as well. We also couldn’t pin the performance issues on a single view - there were often different Django views at the root cause. But we did see a common pattern each time: multiple slow web requests routed to the same server were occupying all uWSGI processes on that server and causing other requests to wait.
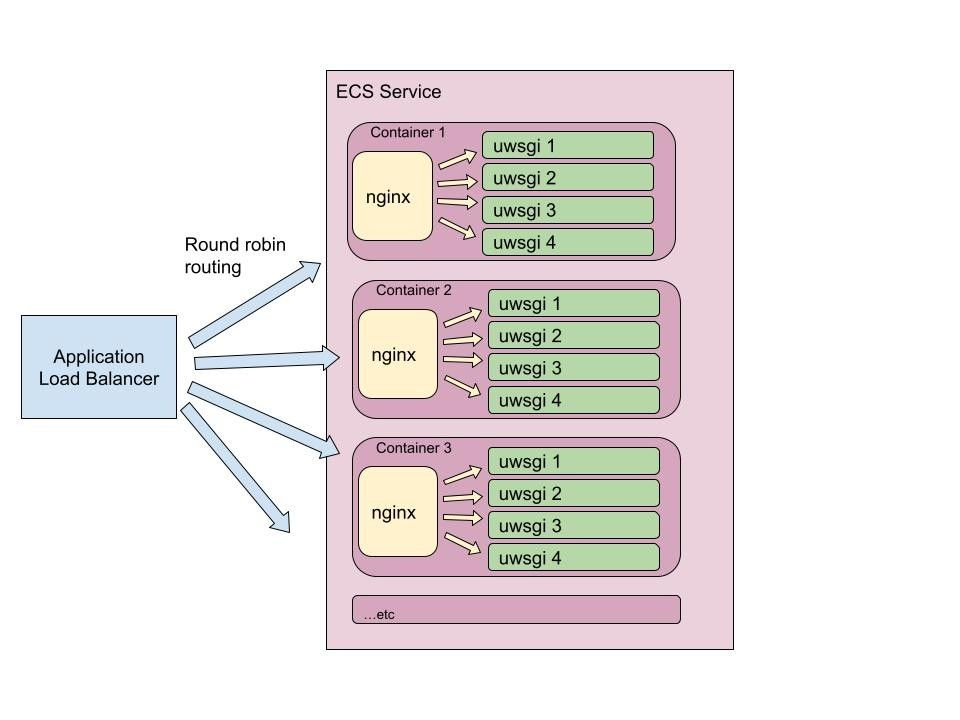
For background, here’s our stack at a high level: Our main containerized app runs an nginx web server, passing requests to four uWSGI processes that each run a Django app. We run fleets of these container instances to serve web traffic in production, and these are split into several target groups (groups of servers handling specific url paths) behind a load balancer.
Digging in, we found a couple different issues at play that made it difficult to identify a single root cause for these timeouts:
- Slow Django Views: Some views (“routes”) were taking forever to load, often over 60 seconds. In some cases, the routes were slow for specific users with large amounts of data (e.g. rendering large pdf invoice statements). In other cases, routes would become temporarily slow due to factors such as database resource contention.
- Inadequate uWSGI Timeout Settings: Differences between the timeouts configured at the nginx layer and uWSGI layer meant that the uWSGI process would continue to run, even after the nginx server timed out and returned a 504 error to the client. In many cases, the user would hit refresh on their browser, compounding the problem and occupying a second uWSGI worker while the slow route ran again.
- Shared Infrastructure: Our primary app is mostly monolithic - many teams contribute code that runs as part of the same target group. One team’s slow route could cause another team’s routes to appear blocked, creating dependencies across teams for fixes.
- Poor Visibility: We did not collect metrics on which routes experienced timeouts and how frequently this occurred. We needed to search our application logs to gather information, and this usually happened in response to an application uptime alert. We also had no visibility into whether we were using our application container resources or routing requests effectively. If we unlocked these insights we could make informed platform adjustments - to both uWSGI processes and our load balancing algorithm - significantly improving capacity.
We knew we couldn’t just fix a few Django views, or add more server capacity - we needed a multi-faceted approach to improve the user experience. What followed was a 4 month project we deemed the Speedy Routes Initiative. It involved improvements to monitoring, uWSGI, Django, and AWS infrastructure, all via a coordinated cross-team project. The result: We have not seen a timeout alert in over three months.
Quick(ish) Fix: uWSGI Timeouts
As mentioned previously, we had configured timeouts in nginx but not uWSGI. To protect against long running requests, uWSGI provides a harakiri setting, which terminates requests after a given number of seconds and recycles the worker. But before we could add uWSGI timeouts with harakiri, we identified several risks that needed to be addressed.
First, we needed to make sure that canceling requests did not leave Cedar’s users in a bad state. For example, if a workflow required multiple database writes, we would want those to succeed or fail together in a transaction in case the request failed partway. Or for cases where a canceled request would leave a user in a pending state, we wanted to know if there was a retry or remediation process.
There was also the risk of many harakiri events occurring within a short period of time, which would diminish the application’s capacity to respond to requests. It takes about 10 seconds for uWSGI to replace the terminated worker in our case, and we had concerns that this waiting period could result in a backlog of inbound requests.
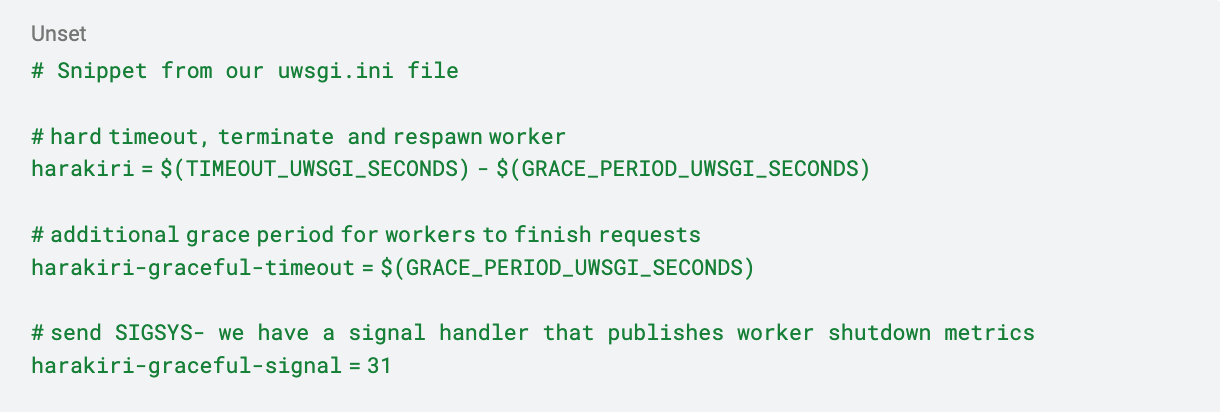
Lastly, when a worker is terminated by uWSGI, we lose any metrics and traces that we typically collect at the end of a request. We could use the harakiri-graceful-timeout parameter to give the worker an additional grace period after the harakiri time limit is reached. With harakiri-graceful-signal, we can configure which signal (e.g., SIGSYS) to send to the worker during this grace period, and register a corresponding signal handler for each inbound request to publish metrics. Though it’s not guaranteed that each uWSGI worker will successfully process the signal during the grace period, the published information can provide valuable insights about where code execution is stuck.
Ultimately, we added the following uWSGI configurations, which were very effective at mitigating slow web requests. We started with a very high value for TIMEOUT_UWSGI_SECONDS, but through collaboration with other teams in the Speedy Routes Initiative (see “Bring in the Cavalry”), we addressed the above risks on all routes and gradually lowered TIMEOUT_UWSGI_SECONDS until it was well below our nginx timeout of 60s.
Better Visibility: Metrics Collection and Synthesis
Before we could dive into fixing specific slow routes, we had to be able to analyze and stack rank the worst offenders. We were already collecting a response time metric for every route, and graphing that in a Web Request Performance dashboard. This was a great start, but it had a few gaps.
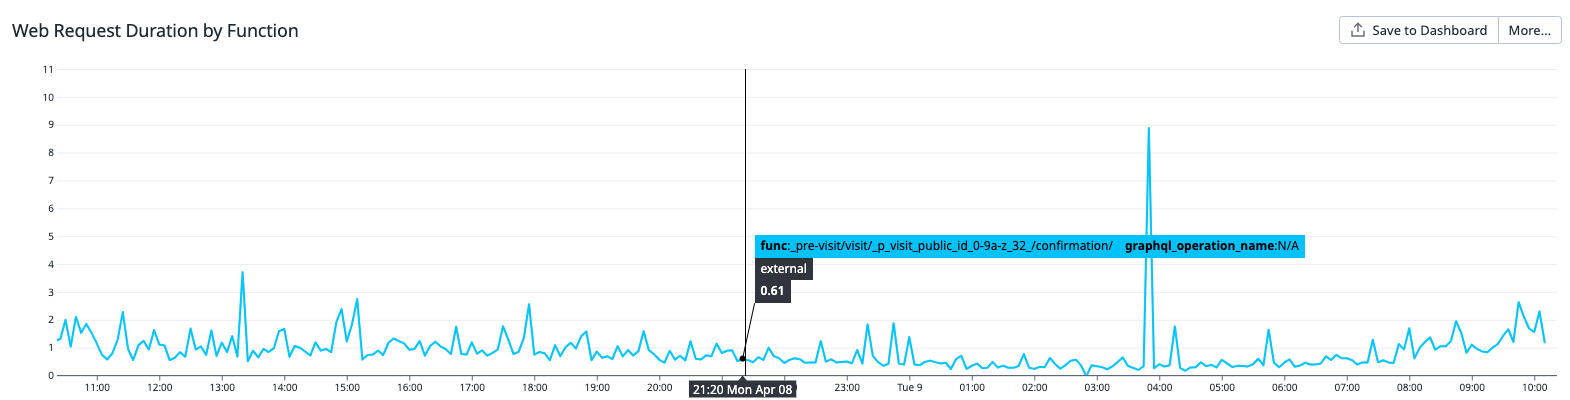
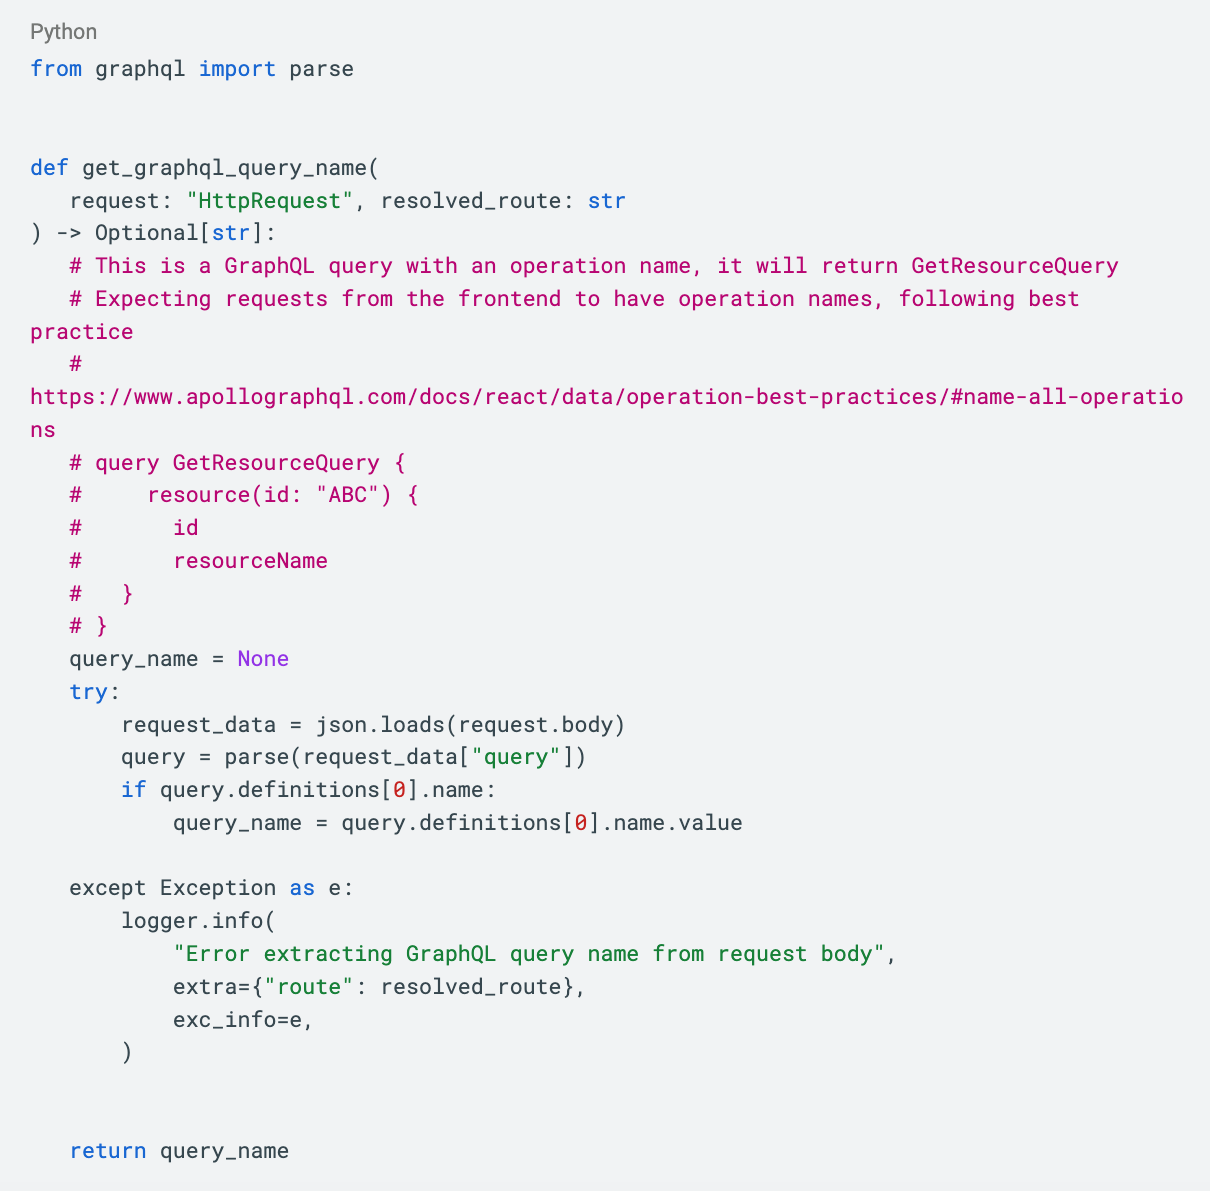
First, all of our GraphQL requests use a common url path, while the body of the request is what contains the actual GraphQL query or mutation being requested. So we only had a single response time metric for all our GraphQL requests and couldn’t identify the problematic operations. To fix this, we modified our middleware to inspect the body of GraphQL requests, and tag the response time metrics it created with the GraphQL operation being requested.
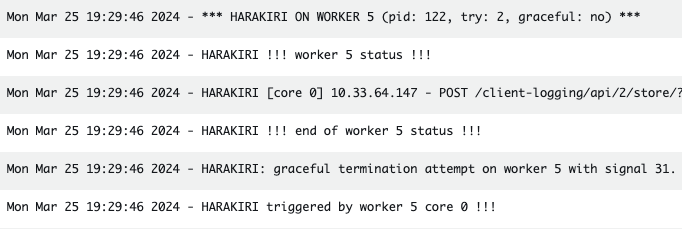
Second, after we implemented uWSGI timeouts, we noticed that we could not reliably capture response time metrics for terminated requests. Some terminated requests can publish metrics during the harakiri graceful shutdown window, but we needed a way to track all harakiri events. To do this, we wrote a lambda that consumed logs and looked for harakiri timeout log statements. It created a “uWSGI timeout” metric tagged by route, for each occurrence. That enabled us to monitor terminated requests without needing to query logs manually, and from there we could focus our efforts on reducing those metrics.
Harakiri log statements:
Resulting metric graphed:
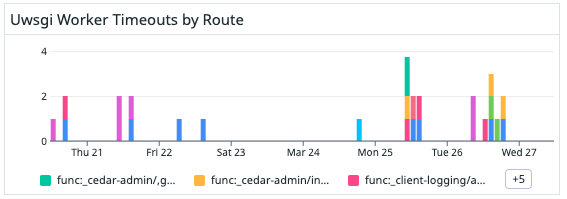
With better metrics, we could now fan-out the work of fixing individual routes to teams.
Bring in the Cavalry: Cross-Team Collaboration
Most of Cedar’s application code runs in a monolith, and multiple teams and product lines share resources, such as the user login flow and the home page. This shared setup allowed slow routes from one team to impact other parts of the application. While teams monitoring the performance of their routes may have been aware of bottlenecks, they didn’t immediately see how this impacted other requests and could prioritize fixes appropriately.
Cedar’s Architecture Steering Group regularly prioritizes cross-team projects that align architecture and business goals. We proposed to this group a project to collaboratively investigate and improve our slowest routes. If we could speed up the routes and make sure they could be gracefully canceled, then we could implement stricter uWSGI timeouts. And we would share any new performance monitoring tools and workflows from the project with the rest of the engineering organization.
As part of the project proposal, we reviewed the uWSGI request times of the prior 30 days to identify the routes with the highest number of requests exceeding nginx timeout thresholds. These routes had the greatest likelihood of being canceled, and we wanted to make sure we understood the user impact of canceling these requests. We shared these routes with tech leads and managers to identify the appropriate people to work on this Speedy Routes Initiative.
After the project was selected, each of the participating teams had 3 months to investigate the performance of their routes and identify short term and long term fixes. They also needed to confirm whether requests could be canceled gracefully, and if not, what would enable cancellation. Along the way, project participants shared strategies for performance monitoring, such as creating custom trace spans in Sentry and linking local development workflows with Sentry performance monitoring. In response to their feedback, we added options to modify Sentry sampling rates for specific routes, trace GraphQL requests, and tag performance metrics to specific teams.
By the end of the project, all the selected routes had at least a short term fix put in place, or were scheduled for deprecation. Teams identified ways to improve performance by optimizing queries, caching data, and moving processes to asynchronous jobs. Several teams identified longer term investments, such as changes to the underlying data models or new vendor workflows. We lowered the uWSGI timeout thresholds and found them to be extremely effective in capping request times and reducing the impact of a slow request on the rest of the application. Finally, we identified ways to enrich the data we get from our existing monitoring tools (Sentry and Datadog).
Going Down a Layer: Platform Changes
Our Platform team improved response times with three key initiatives - collecting more metrics, better load balancing, and increasing server capacity.
Rather than simply adding more web servers, we first wanted to know how busy they were. We could see CPU and Memory stats, but we didn’t have any visibility into the nginx or uWSGI layers of the stack. To fix this, we deployed the Datadog agent as a sidecar container alongside our web servers, and enabled our app to publish nginx and uWSGI metrics to the sidecar. This allowed us to see things like uWSGI busy workers - a count of how many uWSGI processes are handling requests at any given time:

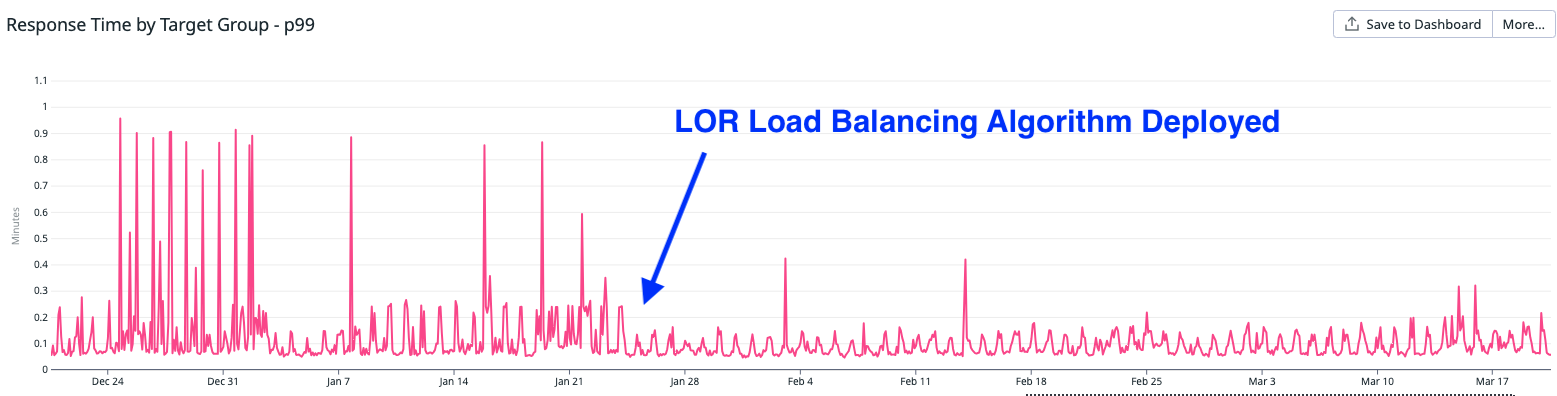
With these metrics, we could see that slow requests could occupy all 4 uWSGI processes on a given server, while other servers still had idle uWSGI processes. Our load balancing algorithm (round robin) wasn’t smart enough to steer requests to the servers with idle processes. So we explored, tested, and then deployed a change to our load balancers to use the Least Outstanding Requests (LOR) algorithm instead. With LOR, the load balancer steers requests to the server with the fewest outstanding requests, thus avoiding any servers that may be blocked handling a few slow requests. With this change, we saw a 19% decrease in the p99 response time and most importantly there were a lot fewer spikes (instances of slow requests).
Finally, the Datadog agent also gave us process-level cpu and memory metrics for the first time, so we could see the resource utilization of every uWSGI process in our containers rather than just the container as a whole. Armed with this information, we could see clearly that we had capacity on our existing AWS instances to add more uWSGI processes without having to increase sizing (cost). We were able to increase uWSGI worker counts from 4 to 6, thus giving us 50% more capacity to serve requests, for no additional cost.
What’s Next
The Speedy Web Routes project demonstrated how everything from our infrastructure setup to our business logic impacts the amount of time a user waits for a response. With all these improvements, we haven’t had a timeout alert in over three months! Our users are happier because our app is more responsive, especially for the 1% of slowest requests. Cedar engineers on call are also happier because there are fewer pages interrupting their day.
That said, there is definitely still more we can do. While we have timeout monitoring, we’d love to go further and proactively identify routes whose response time degrades. We have tested this a bit, but it’s proven tricky to make monitors that are appropriately tuned to only catch significant lasting changes in response time. Additionally, we want to introduce a pattern for defining route-specific timeouts which are lower than the harakiri uWSGI timeout. Something based on alarm signals may work. We could use this in select places and avoid having the uWSGI hard restart, which can take over ten seconds in our case. Luckily, the improvements we’ve made have bought us the time and headspace to be able to focus on these challenges.
About the Authors: To learn more about Chris Crane and Julia Wu, check out their LinkedIn profiles.
To learn more about Cedar, visit our website here.
Interested in a career at Cedar? Check out our careers page.