
Great performance is critical to a reliable app. Improving app performance is complex to begin with, but it becomes compounded for apps experiencing hypergrowth as more database issues start to surface.
As engineers, we expect this. Databases typically start as a one-server instance, making them a single point of failure. They’re also I/O intensive machines that have to handle hundreds or thousands of queries per second (I/O is notoriously slow). Databases are built for reliability first and foremost, which can add overhead (think ACID compliance), further compromising performance. Consider how Justin Bieber would regularly crash Instagram's database, or how Google needed to invent their own database, BigTable, to scale search.
So if you’re running into application scalability issues, or expect to at some point, let’s take a look at how you might try to scale a database.
Database scaling 101
One strategy is to scale your database’s infrastructure. You can generally do this in two ways:
- Vertical scaling: taking your database and beefing up its CPU, RAM, storage size/performance, etc.
- Horizontal scaling: creating replicas of your database used for distributing reads, sharding to distribute reads and writes, etc.
There’s also a more esoteric strategy: query tuning. Query tuning is the process of optimizing or eliminating queries to reduce database load.
Query tuning can be difficult because it's not always obvious how to massage a query to make it more performant, so you sometimes have to use intuition and understanding of database architecture to rewrite it. There are no cut-and-dry rules that work for all queries—you have to know the particulars of your schema and querying patterns to have the most impact.
Query tuning has one distinct advantage, however: It makes your entire system more performant because you’re reducing your database load by changing the logic in your application. It allows your application to function as before, but in a cost-effective and less complex way because you’re reducing extraneous queries and improving those you don't remove.
If you’re using Python, you’re probably using an object relational mapper (ORM). An ORM lets you interact with rows in your database as if they are objects, meaning you can insert, read objects and translate code into SQL statements that will become inserts, updates, deletes, selects, etc.
Django evaluation
Imagine you’re working on a large python app, with many levels of nested function calls, queries all over the place and database performance problems. Unfortunately for you, the app is written in Django’s ORM, and you’re neither an expert in Django nor Python ORMs in general.
But you start debugging anyway, and you run into ORM code that looks completely different from the emitted SQL because ORMs are written in an object-oriented way. Moreover your ORM (like many) is written with a lot of syntactic sugar to help programmers solve problems quickly.
So you look at the following code:
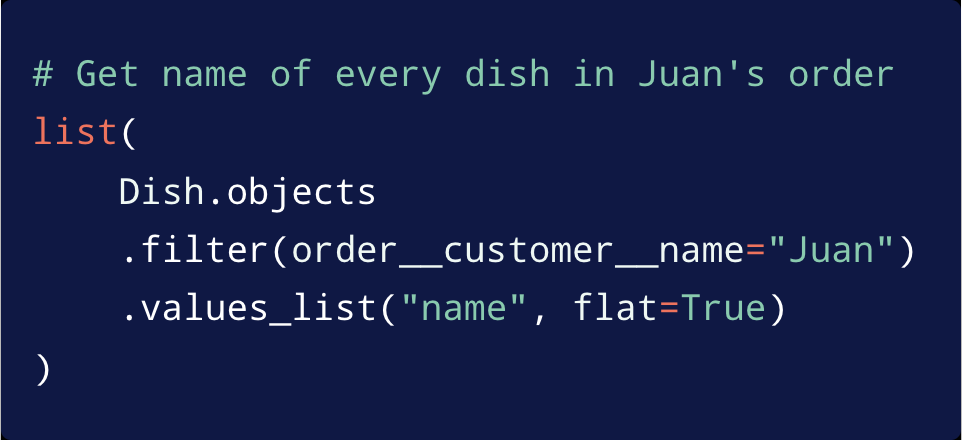
The code tries to fetch every dish and order from some fictional dish table. And what you see here (if you're not an expert in Django) might surprise you when you see the SQL that gets generated:
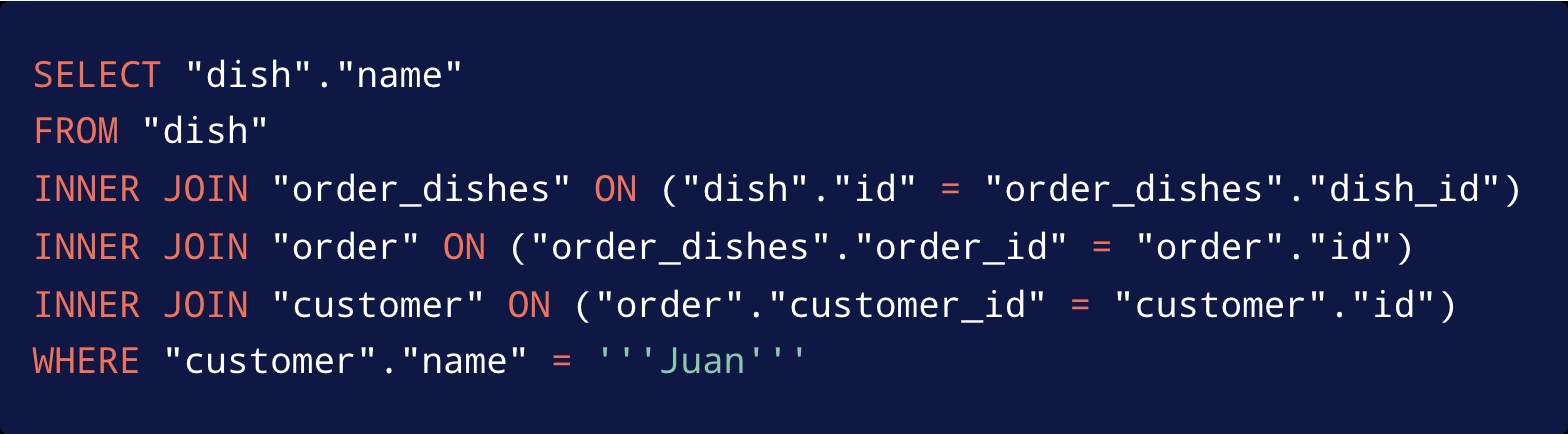
What we're seeing here are actually four different tables being joined. As you can see, it’s not always crystal clear from the Python code exactly what SQL will be generated by a particular piece of code.
That’s just the first problem you run into. So you learn how to use Django efficiently and figure out how it translates its ORM and query sets into SQL statements. But then you start to realize that you know which queries are being executed, but aren't sure when and why they're getting executed.
In other words, you're not exactly sure of the full call chain that led to it. Or maybe you really want to know what the stack trace is for a particular execution of a query, and you just don't have the information available. Unfortunately, just knowing where the queries are being executed at the final step doesn't give you a lot of insight into how to perform app updates on a broader level.
Another example: how many queries do you think are being executed here?
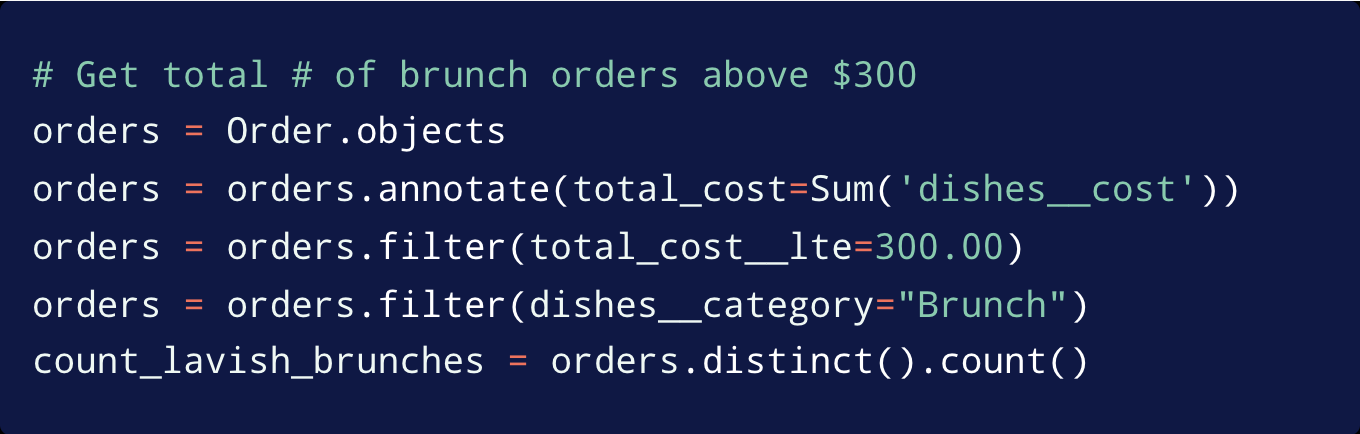
This might look like as many as five queries, but it’s just one. And the single query is at the very end because in Django there's a lot of a lazy evaluation happening. So unless you're an expert this just might be confusing for you.
The N+1 queries problem
There’s another problem. Imagine you're trying to fetch all of the information for a user, but instead of fetching it all at once, you’re going to fetch every single user and then collect data from additional tables for each user. This can further cascade if the results of those queries cause you to execute even more queries per result.
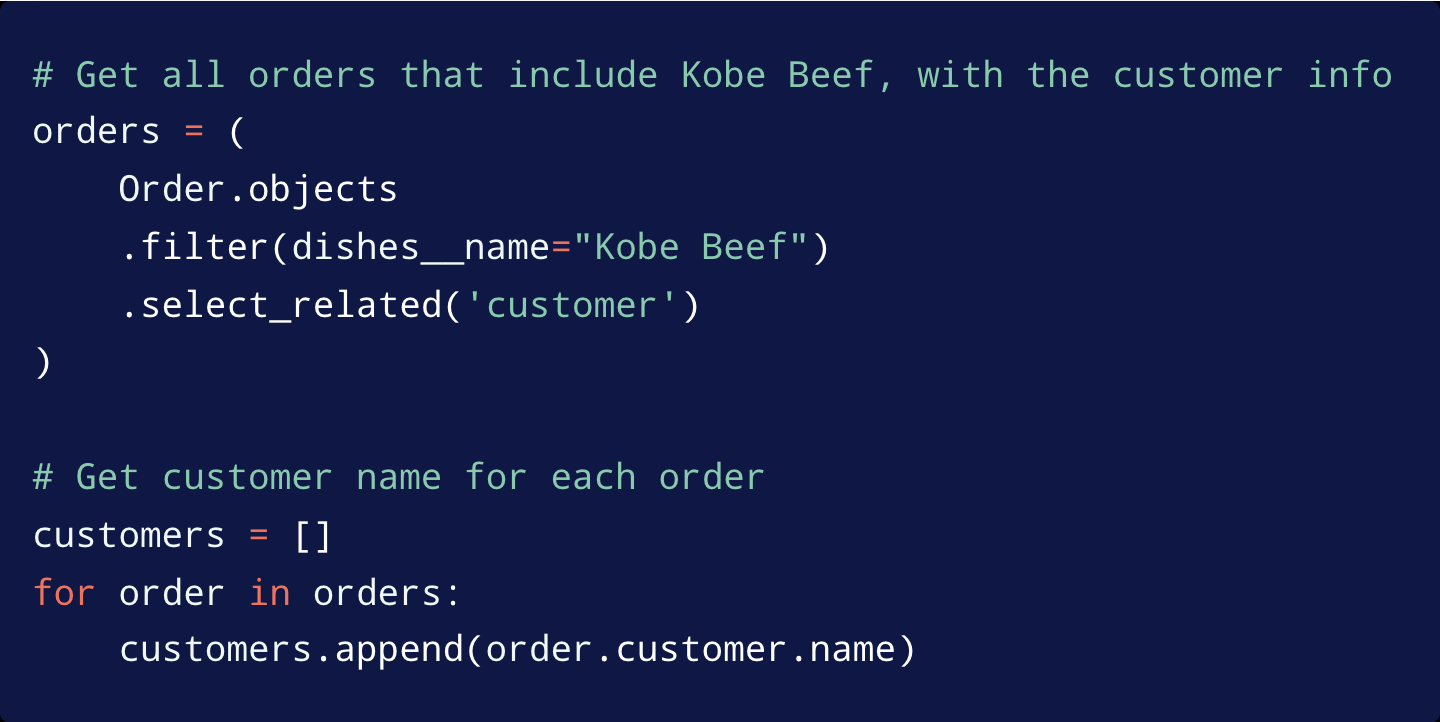
Check out this code:
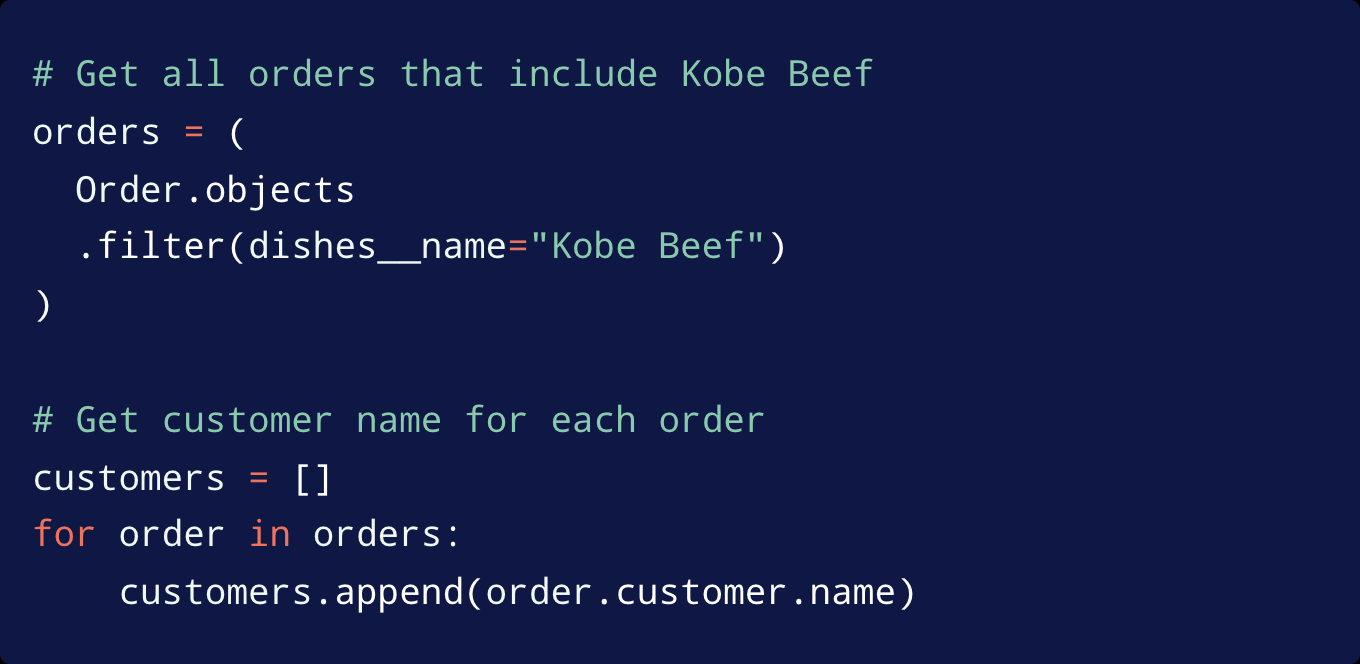
Seems benign, no?
We’re fetching all Kobe Beef orders, and for each we’re trying to fetch the customer name for the order. But in this example, we're fetching the customer for every single order, one at a time.
So the SQL that gets generated is one query to get all the orders that have Kobe beef as a dish. Then we're going to do one query for the first order to fetch the customer named for that, an additional query for the second order to get the customer named for that, and so on.
Here’s a better option:
The code looks similar, but that one line changes everything. It produces one SQL statement, which reduces database round trips and fetches all of the data in one go.
Query tuning may sound like it requires advanced knowledge of Django, ORMs and a codebase that you may not have written yourself. But in reality, it can be easy.
In 2019, we at Cedar were addressing these same problems. We were in fast-growth mode with a Django code base and concerned about scaling. So we introduced infrastructure solutions.
We scaled our database vertically and horizontally, but we needed to figure out a solution to this query tuning problem because we thought we might have a better answer.
Enter query snapshots
We needed a tool to tell us exactly what and where queries were being executed, i.e. a complete stack trace. We wanted it to show the actual code triggering queries, and we wanted it to tell us information at any stage of local development—not just in a particular context.
Of course, we also wanted it to have a simple intuitive interface. So we created a tool called Snapshot Queries, which is really just an ORM query capture context manager. In practice, if you wrap your code in this context manager and let it execute, it will generate a list of every query executed by the ORM regardless of whether you're using Django.
That system enables inspection of each and every query executed in any context of code from any location. You can see the actual SQL statement for the Python code that was executed for that query, and the actual time it took to execute the query.
Right out of the box you can complete a summary of every query executed for any snippet of code. Here’s how you’d use it in your code:
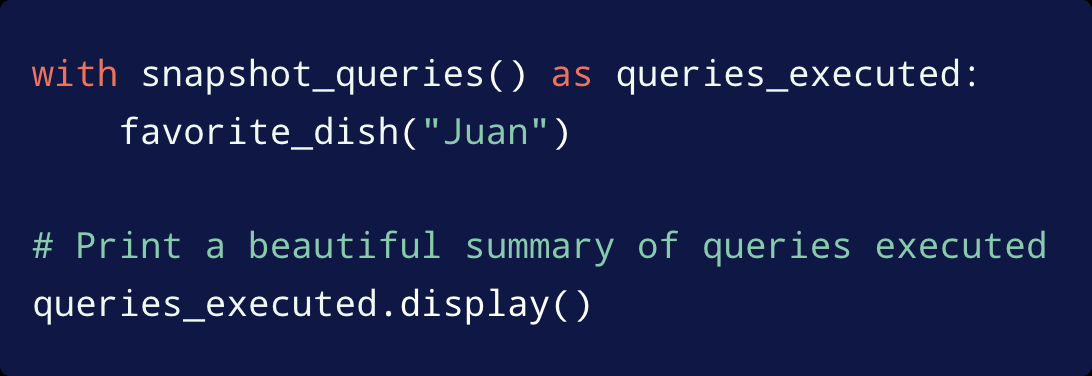
And here’s the output:
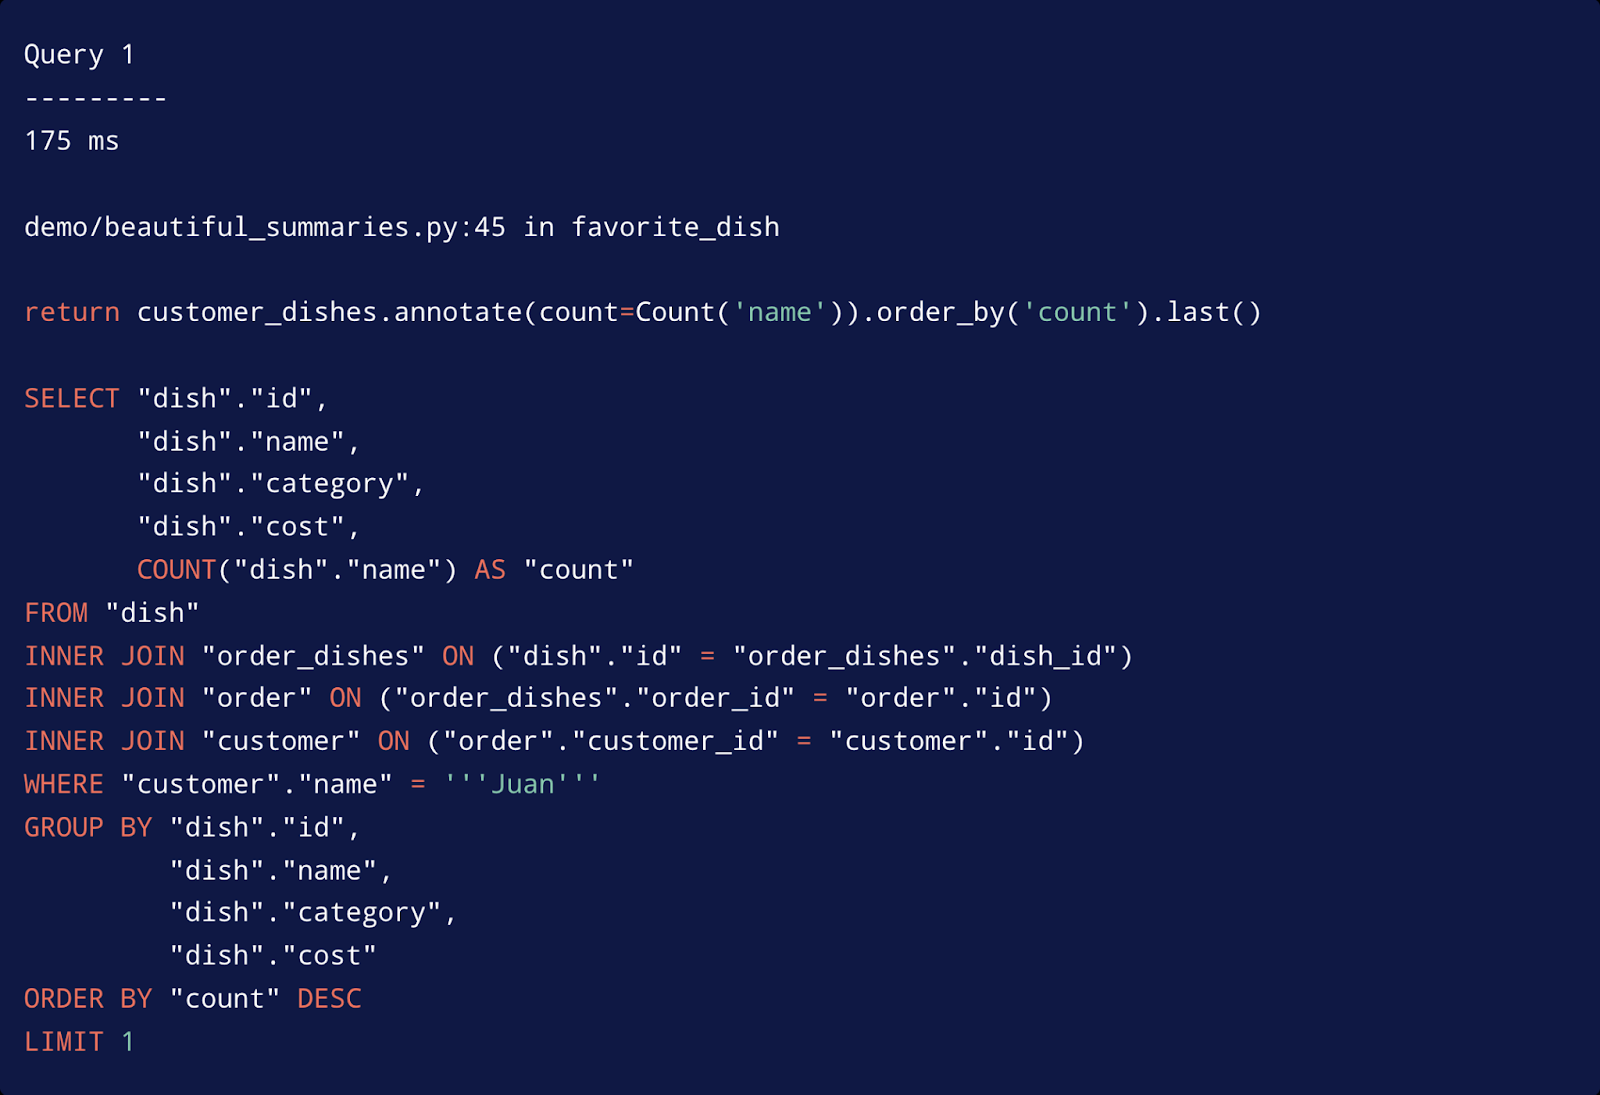
Information includes how long the query took to execute, the line of code in your system that triggered it and the Python code itself that triggered it, as well as SQL statements executed on your database.
But sometimes you need the full context, which is where the full stack trace comes into play. With this tool, that’s easy. You can just look and see the stack trace that led to the ORM querying the database.
Additionally, you can group similar SQL queries, putting an end to the N+1 query problem.
This query snapshotting logic also works in your tests. If you wrap a section of code in the context manager, it will output a file containing all queries executed within the context, like so:
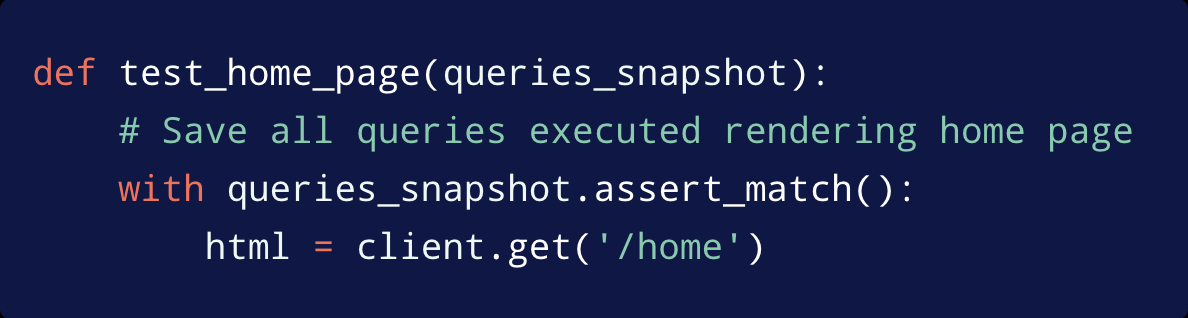
On subsequent runs, executed queries are compared to the previously-generated snapshot and any changes get surfaced as test failures. This can help you catch situations where a change is made to the code that generates suboptimal querying (e.g. an excessive number of queries or an inefficient query filter). Of course, if the changes are expected, you can update the snapshots. This has the added benefit of making it easy for code reviewers to validate any changes to your queries.
For more, check out Cedar's recent appearance at PyCon discussing how we use Django snapshots: